Crisis Room
In OpenKAT we differentiate two Crisis Rooms:
Single Organization Crisis Room: a Crisis Room for each organization separately
General Crisis Room: one general Crisis Room for all the organizations
Single Organization Crisis Room
This page shows a Crisis Room for each organization separately. Here, a user can create its own dashboards.
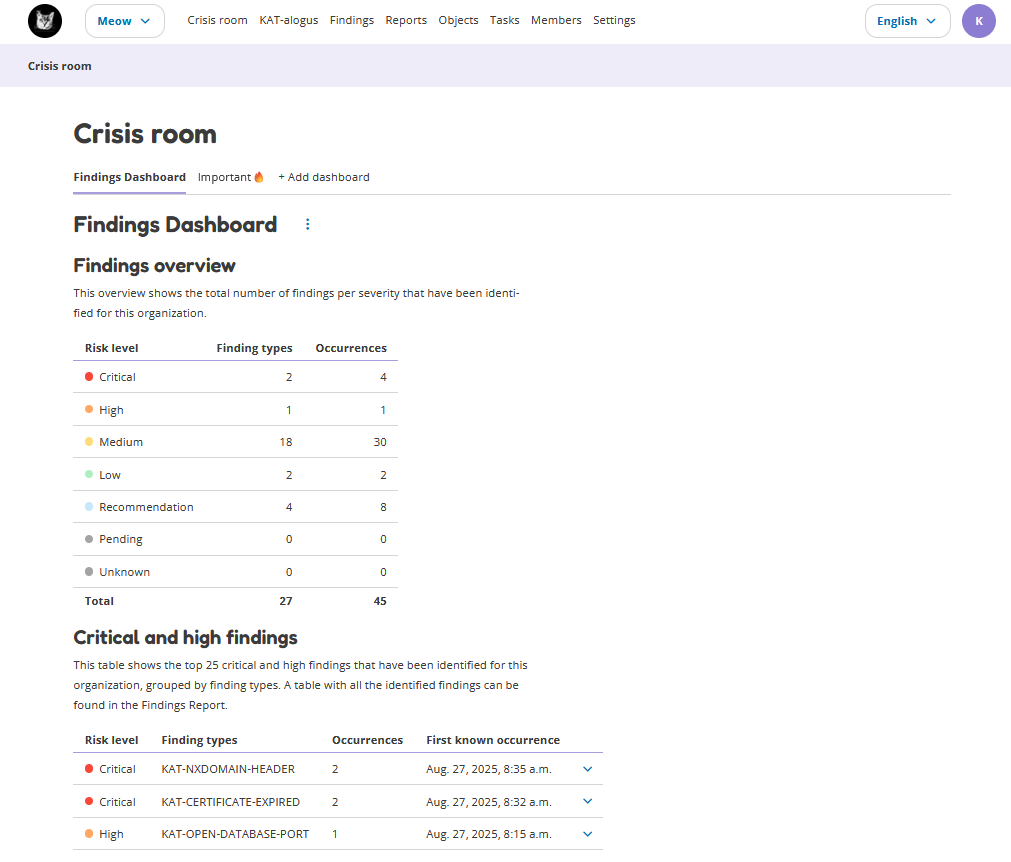
Findings Dashboard
There is always one default dashboard, the ‘Findings Dashboard’, where you can see the most important findings at a glance. This section shows an overview table with the amount of findings that have been identified for the selected organization.
Also, the top 25 critical and high findings that have been identified for this organization are shown in a table here, grouped by finding types.
Custom Dashboards
It is also possible to create a custom dashboard. Creating your own dashboard provides an overview that fully meets the needs of your organization.
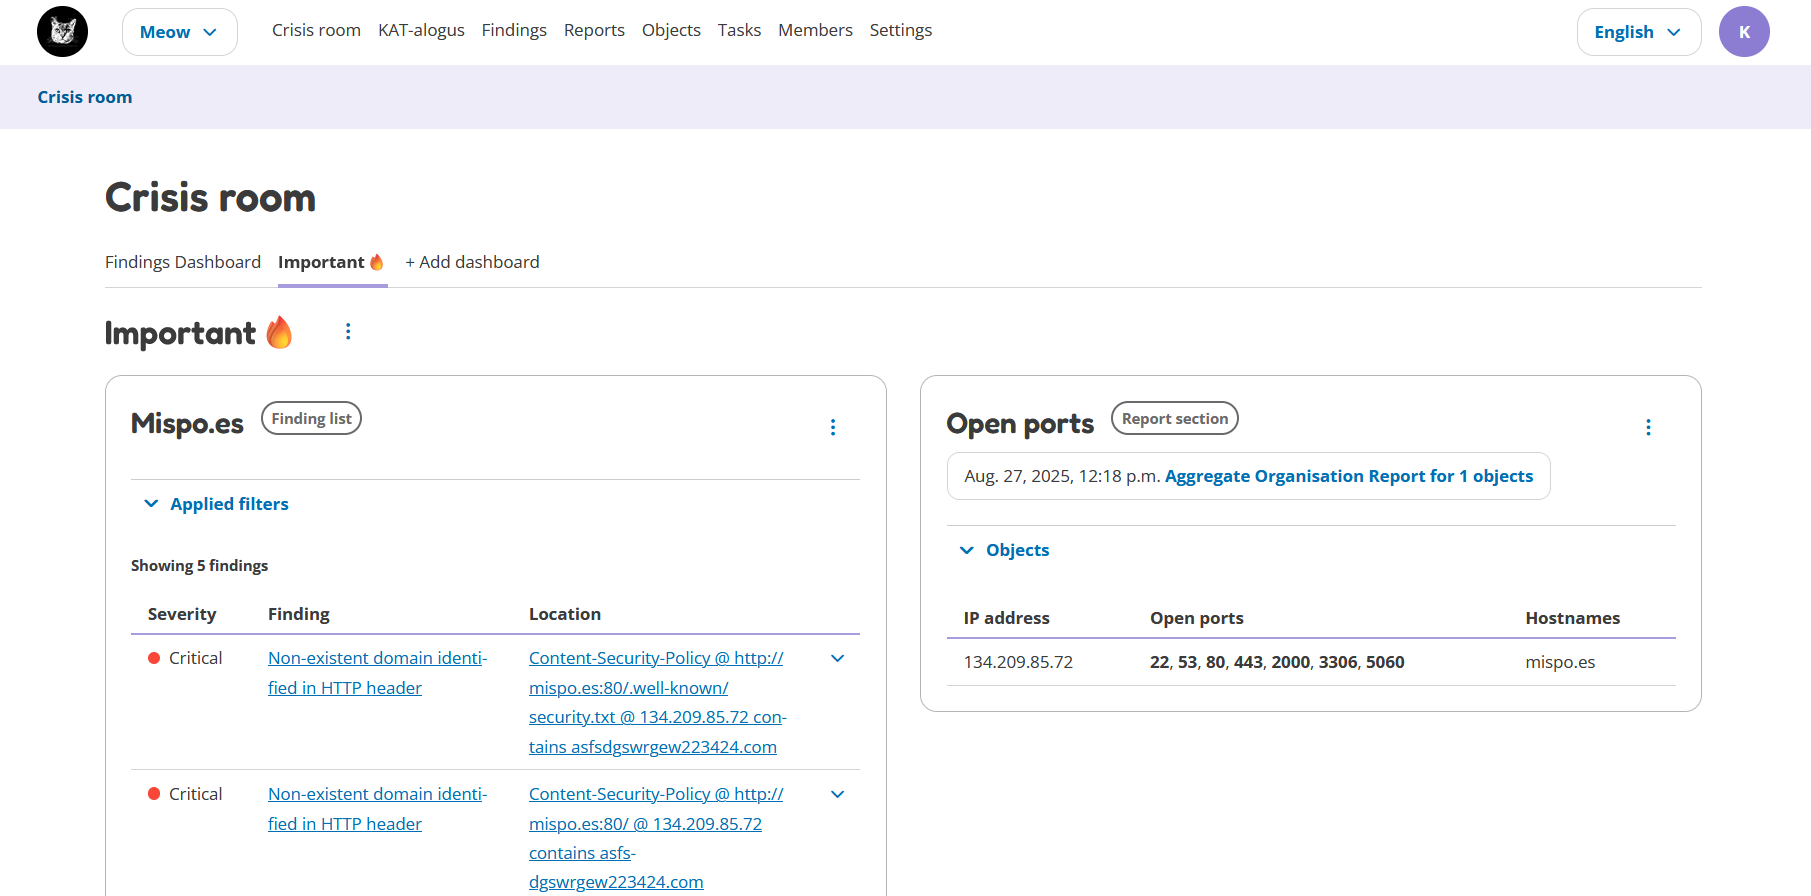
By clicking on the ‘Add Dashboard’ button, a new dashboard will be created. After adding the dashboard, you can add items to it. Each dashboard can contain a maximum of 16 dashboard items.
There are three types of dashboard items which you can add:
Object list: a copy of the objects list, with applied filters (can be added from the Objects page)
Finding list: a copy of the findings list, with applied filters (can be added from the Findings page)
Report section: a copy of a specific chapter of a report (can be added from within a report)
The dashboard items can be moved up/downwards and can be deleted.
Adding A New Dashboard Item
Objects/Findings list
To add a new objects or findings dashboard item to a dashboard:
Go to the Objects or Findings page
Filter the table as you prefer (the same filters will be applied to the table in the dashboard item)
Click on the ‘Add to dashboard’ button, this opens a pop-up
Choose the settings as you prefer
Click on the ‘Add to dashboard’ button
The following settings can be configured:
Dashboard: Select the dashboard to which you want to add the dashboard item.
Title on dashboard: Give the dashboard item a name.
List sorting by: This is how the table in the dashboard item will be sorted.
Number of rows in list: Choose how many objects/findings you wish to show in the dashboard item.
Dashboard item size: A dashboard item can be full or half width. Two half width items will be displayed next to each other.
Show table columns: Select at least one column you want to show in the dashboard item.
Report section
To add a report section:
Go to the Reports History page
Open the report of your choice
Go to the section that you want to add
Click on the options button (three dots) next to the section name
Click on ‘Add section to dashboard’
The following settings can be configured:
Dashboard: Select the dashboard to which you want to add the dashboard item.
Title on dashboard: Give the dashboard item a name.
Dashboard item size: A dashboard item can be full or half width. Two half width items will be displayed next to each other.
Permissions
There are several permissions for the crisis room. All users have the permission to:
View dashboards and dashboard items
Change the position of dashboard items
Additionally, admins and redteamers have permission to:
Create new dashboards
Add new items to a dashboard
Change dashboards
Change dashboard items
Delete dashboards
Delete dashboard items
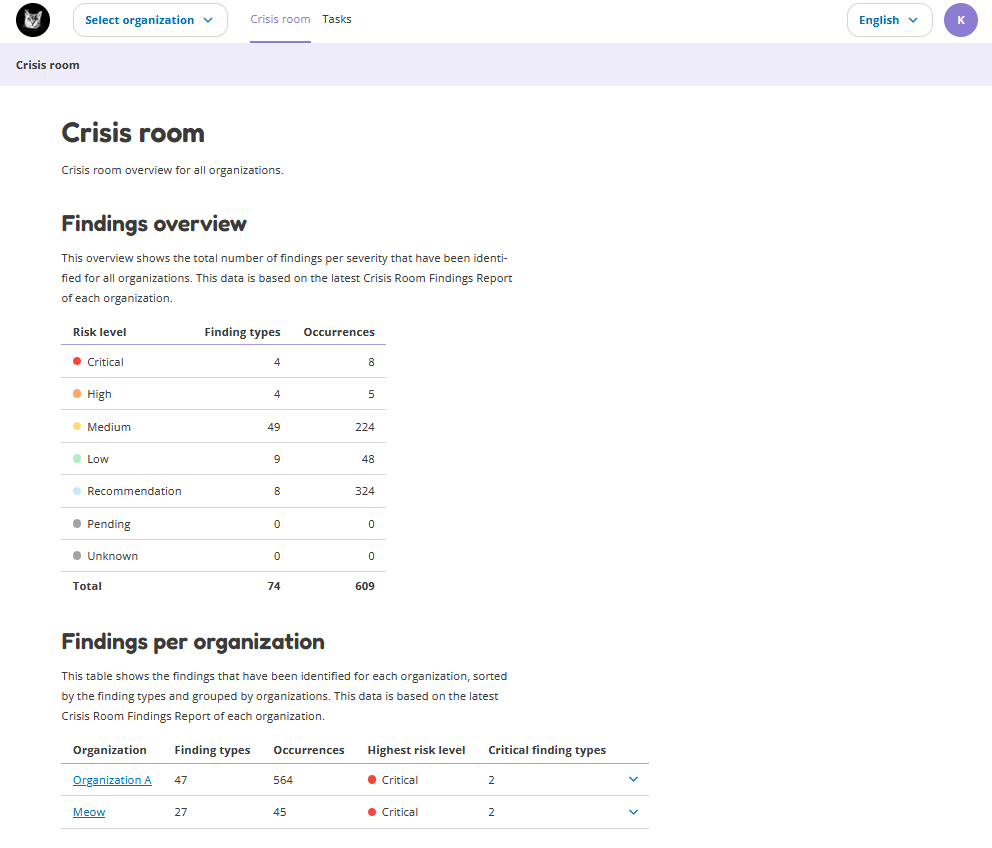
General Crisis Room
This page shows the Crisis Room for all organizations. Currently, this Crisis Room only shows the Findings, but in the future it will also show dashboards, which can be customized by the user.
Findings
This section shows all the findings that have been identified for all organizations. These findings are shown in a table, grouped by organization and finding types.
The findings shown in this general Crisis Room have been collected by the ‘Crisis Room Aggregate Report’. This report is based on a recipe, which has been automatically created by OpenKAT for each organization. The output of this report for each organization is shown in this general Crisis Room.
The default settings for this report recipe are:
report_name_format =
Crisis Room Aggregate Reportooi_types =
["IPAddressV6", "Hostname", "IPAddressV4", "URL"]scan_level =
[1, 2, 3, 4]scan_type =
["declared"]report_types =
["systems-report", "findings-report"]cron_expression =
0 * * * *(every hour)
It is possible to update the report recipe*. To do this:
Go to “Reports”- Click on the tab “Scheduled”
Look for the “Crisis Room Aggregate Report”
Open the row
Click on “Edit report recipe”
*Note: if you want to update the report recipe, you have to do this for every organization.